Current issue
Author:Huai-Wen Tsao, Yu-Shun Huang, Shou-Horng Huang, Po-Yu Lai, and Ming-Hsin Lai*
Abstract:
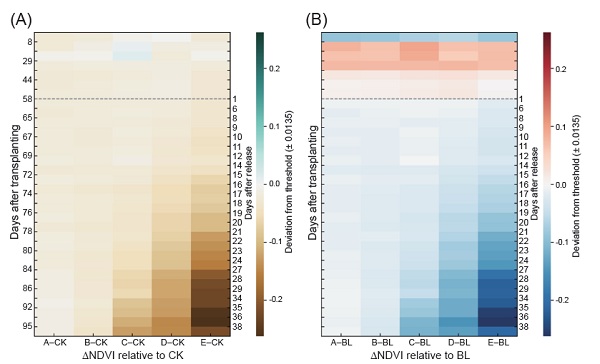
This study focuses on the brown planthopper (Nilaparvata lugens (Stål)), a major pest in rice cultivation, and proposes an early-stage pest detection approach that integrates artificial infestation experiments with unmanned aerial vehicle-based multispectral imaging. Treatments with varying insect population densities were simulated, and rice spectral responses were monitored using multispectral imagery collected during the experiment. In this study, the term “early stage” refers to the period between the panicle initiation and heading stages, and corresponds to the typical outbreak period of brown planthopper (BPH) infestations in the second cropping season. Results showed that when the normalized difference vegetation index (NDVI) deviated from the control group by more than the natural variation range (± 1s), such deviation could serve as an early-warning signal with the potential to indicate the onset of BPH infestation. The feasibility of using rice plants near field borders as a substitute reference for formal control plots was also evaluated to improve the feasibility for field operation. The proposed approach provides a quantifiable basis for pest monitoring and serves as a potential alternative to traditional manual scouting in the context of smart agriculture.
Key words:Brown planthopper, Insect pest monitoring, Multispectral, Smart agriculture
Download:![]() PDF Links
PDF Links
Taiwan Agricultural Research
 Submit your manuscript
 Guide for authors
- 1. Agricultural Drones, a Modern Tool for Agricultural Multi-applications and Future Perspectives
- 2. Integrated Pest Management Strategies for Strawberry Production in Taiwan: A Review of Technological Innovations and Implementation Challenges
- 3. Challenges for Sustainable Pest Management Utilizing Indigenous Natural Enemies in Chrysanthemum Fields in Okinawa