All issues
Author:Chien-Hui Syu, Yu-Wen Lin, Bo-Jiun Yang, Sung-Lin Chuang, Chia-Yi Cheng, and Kai-Wei Juang*
Abstract:
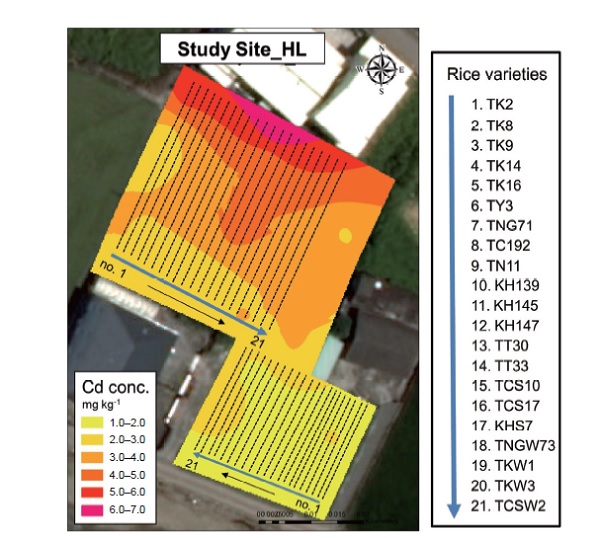
Paddy rice (Oryza sativa L.) is the staple food of Asian countries. However, paddy rice cadmium (Cd) pollution continuingly happened due to the increase in soil Cd concentration and the issue has attracted more attention. As well known, the accumulation of Cd in rice grains is affected by paddy variety, environmental effects, and the interaction effects between variety and environment. In this study, the GGE bi-plot was used to analyze the main effect of genotype (G) and the interaction effect between genotype and environment (G × E) on Cd accumulation in rice grains. According to the scores of principle components obtained from GGE analysis for different rice varieties, the bi-plots thus were drawn to illustrate the levels of environmental effect on rice genotypes. There were two Cd-contaminated sites in Houli District (HL), Taichung City, and Changhua City (CH), respectively, for a multiple-environment trail to plant 21 rice cultivars in 2 crop seasons. The Cd concentrations in rhizosphere soil samples and brown rice for the rice varieties were measured, and then the observed data were used to screen out the environmentally stably low Cd-accumulation varieties. The results show that most indica varieties had higher cadmium accumulations than japonica rice did. The profiles of brown rice Cd concentrations for the paddy varieties in sites HL and CH are different. The lower Cd-accumulation varieties in HL were not completely consistent with those in CH. This revealed that the interaction between genotype and environment would be a dominant figure in brown rice Cd concentrations. In addition, according to the GGE analysis, the effect G and the interaction effect G × E on Cd accumulation in rice grains have been transported into the 2 principal components (i.e., PC1 and PC2), which were mutually independent and dominated the variation of G and G × E approaching to 84%. The bi-plot gave PC1 and PC2 as the coordinate axes were used to quantify the variation due to environmental effects in brown rice Cd concentration for each paddy variety. The brown rice Cd concentrations of the varieties, ‘KH139’, ‘TKW3’, ‘TNGW73’, and ‘TT33’, were relatively low and less varied with different sites and cropping seasons. That is, they would be the more environmentally stably low Cd-accumulation varieties. Therefore, Cd concentration and availability in the soil will dominate the Cd absorption by different paddy rice varieties and accumulation in brown rice; the weather condition and management practices in different cropping periods may be a secondary factor. In a comparison of indica and japonica types for accumulation of Cd in brown rice, the indica was superior to the japonica. The relatively stable Cd low-absorption varieties all were japonica rice. One can try to reduce the risk of brown rice Cd being higher than the threshold (i.e., 0.4 mg kg-1) by selecting environmentally stably low Cd-accumulation varieties and adopting the agronomic practices to go into a decline of soil Cd availability.
Key words:Cadmium, Paddy rice, GGE bi-plot, Interaction between genotype and environment, Cultivar
Download:![]() PDF Links
PDF Links
Taiwan Agricultural Research
 Submit your manuscript
 Guide for authors
- 1. Using Digital Soil Mapping to Predict Soil Organic Carbon Stocks in Zhuoshui River Basin
- 2. Development of a Technique for Forecasting (or Pre-Detection) Anthracnose Disease Incidences of Green Mature Bagging Mango Fruits
- 3. Taxonomic Review of the Genus Asiophrida Medvedev, 1999 in Taiwan (Insecta: Coleoptera: Chrysomelidae: Galerucinae: Alticini), with Notes on Biology