All issues
Author:Hsiu-Ying Lu
Abstract:
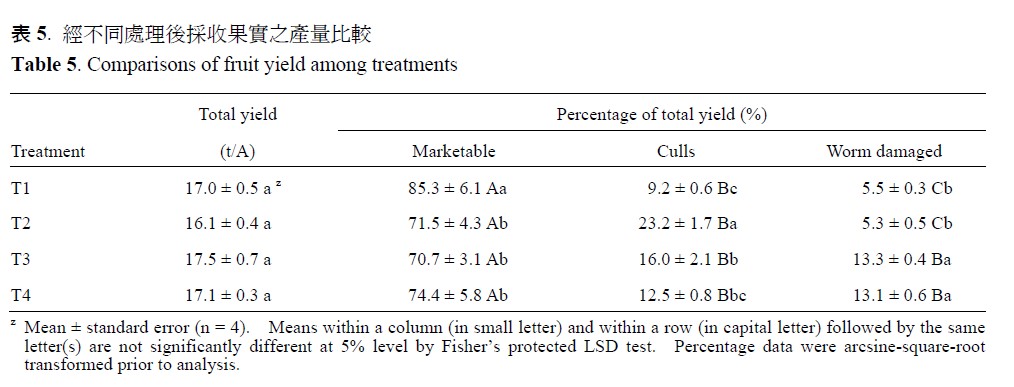
Conveying accurate information is key to the effective presentation of scientific graphs or tables. The analysis of variance (ANOVA) and multiple comparisons are the methods commonly used for comparison of several treatment means in data collection from agricultural research. There are many methods available for multiple comparisons of treatment means; among them, the Fisher’s protected least significant difference (LSD) test is the favorable method for all pairwise comparisons of treatment means. A graph or table is of no scientific merit if the data are not analyzed statistically and presented accurately. The objective of this report is to describe proper procedure for preparation and presentation of statistically analyzed data in the form of scientific graphs or tables for improving quality of scientific publications.
Key words:Analysis of variance, Multiple comparisons, Pairwise comparisons of treatment means, Least significant difference test
Download:![]() PDF Links
PDF Links
Taiwan Agricultural Research
 Submit your manuscript
 Guide for authors
- 1. Development of Tractor-Mounted Seedling Transplanter for Sweet Potato
- 2. Synergistic Effect of Additional Gas on the Toxicity of Phosphine to Sitophilus oryzae and Sitophilus zeamais (Coleoptera: Dryophthoridae)
- 3. Effects of Temperature and Solar Radiation on Growth Traits and Plant Elements in Purple Leafy Sweet Potato