All issues
Author:Shih-Hong Lin, Chun-Tang Lu, Woei-Shyuan Jwo, and Hsiu-Ying Lu*
Abstract:
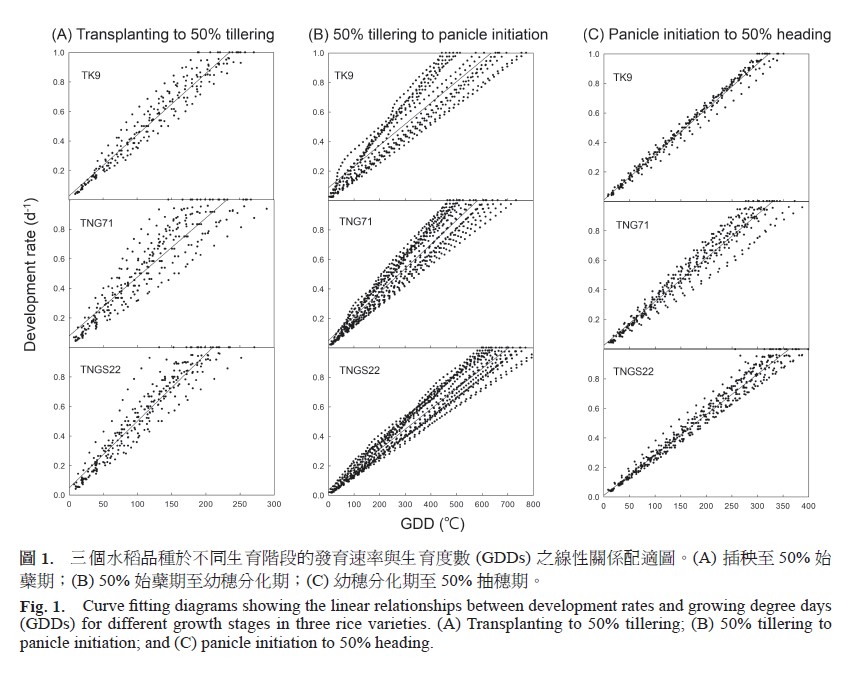
The aim of this study is to establish the models for predicting three major growth stages (i.e., 50% tillering, panicle initiation, and 50% heading) of three mid-late maturing Taiwan rice varieties (i.e., ‘TK9’, ‘TNG71’, and ‘TNGS22’). Data sets were collected from the field experiments of rice varieties planted at various transplanting dates in a two-crop system in 2006–2010. For every growth stage of each variety, a linear regression model for predicting growth stage was established using daily development rate during the period as the dependent variable and its corresponding daily effective accumulated temperature (growing degree days; GDD) as the independent variable. The predictive capability of GDD model was tested by internal validation. It showed that all the 95% confidence intervals (CI) of the differences between predicted and actual values of development rate included zero, which reveals an acceptable predictive error at 5% significance level. Then, all data sets were pooled to build up the GDD models for predicting growth stage. The estimated values of intercept and regression coefficient in these GDD models were within the 95% CI of those estimated values obtained from above validation procedures. Results suggest that the established GDD models for predicting rice growth stages are robust. With these models, GDDs need to reach each growth stage in three rice varieties could be estimated. Results also indicated that these three rice varieties were not completely identical in development rates during the periods of different growth stages. Although they are midlate maturing varieties, the sequence of full maturity for these three mid-late maturing varieties is in the order of ‘TNG71’, ‘TK9’, and ‘TNGS22’. It was due to the growth of ‘TNG71’ was faster during the period from 50% tillering to panicle initiation, while the growth of ‘TNGS22’ was slower during the period from 50% tillering to 50% heading in spite of rapid growth before 50% tillering. Therefore, to increase paddy yield, proper field management should be arranged in critical growth stages in respective rice varieties.
Key words:Effective accumulated temperature, Growing degree days, Linear regression model, Development rate, Predictive error
Download:![]() PDF Links
PDF Links
Taiwan Agricultural Research
 Submit your manuscript
 Guide for authors
- 1. Development of Tractor-Mounted Seedling Transplanter for Sweet Potato
- 2. Synergistic Effect of Additional Gas on the Toxicity of Phosphine to Sitophilus oryzae and Sitophilus zeamais (Coleoptera: Dryophthoridae)
- 3. Effects of Temperature and Solar Radiation on Growth Traits and Plant Elements in Purple Leafy Sweet Potato